
Economic, financial and monetary developments
Summary
At its meeting on 30 January 2025, the Governing Council decided to lower the three key ECB interest rates by 25 basis points. In particular, the decision to lower the deposit facility rate – the rate through which the Governing Council steers the monetary policy stance – is based on its updated assessment of the inflation outlook, the dynamics of underlying inflation and the strength of monetary policy transmission.
The disinflation process is well on track. Inflation has continued to develop broadly in line with the December 2024 Eurosystem staff macroeconomic projections for the euro area and is set to return to the Governing Council’s 2% medium-term target in the course of 2025. Most measures of underlying inflation suggest that inflation will settle at around the target on a sustained basis. Domestic inflation remains high, mostly because wages and prices in certain sectors are still adjusting to the past inflation surge with a substantial delay. But wage growth is moderating as expected, and profits are partially buffering the impact on inflation.
The Governing Council’s recent interest rate cuts are gradually making new borrowing less expensive for firms and households. At the same time, financing conditions continue to be tight, also because monetary policy remains restrictive and past interest rate hikes are still transmitting to the stock of credit, with some maturing loans being rolled over at higher rates. The economy is still facing headwinds but rising real incomes and the gradually fading effects of restrictive monetary policy should support a pick-up in demand over time.
The Governing Council is determined to ensure that inflation stabilises sustainably at its 2% medium-term target. It will follow a data-dependent and meeting-by-meeting approach to determining the appropriate monetary policy stance. In particular, the Governing Council’s interest rate decisions will be based on its assessment of the inflation outlook in light of the incoming economic and financial data, the dynamics of underlying inflation and the strength of monetary policy transmission. The Governing Council is not pre-committing to a particular rate path.
Economic activity
The economy stagnated in the fourth quarter of 2024, according to Eurostat’s preliminary flash estimate. It is set to remain weak in the near term. Surveys indicate that manufacturing continues to contract while services activity is expanding. Consumer confidence is fragile, and households have not yet drawn sufficient encouragement from rising real incomes to significantly increase their spending.
Nevertheless, the conditions for a recovery remain in place. While the labour market has softened over recent months it continues to be robust, with the unemployment rate staying low, at 6.3% in December. A solid job market and higher incomes should strengthen consumer confidence and allow spending to rise. More affordable credit should also boost consumption and investment over time. Provided trade tensions do not escalate, exports should support the recovery as global demand rises.
Fiscal and structural policies should make the economy more productive, competitive and resilient. The Governing Council welcomes the European Commission’s Competitiveness Compass, which provides a concrete roadmap for action. It is crucial to follow up, with further concrete and ambitious structural policies, on Mario Draghi’s proposals for enhancing European competitiveness and on Enrico Letta’s proposals for empowering the Single Market. Governments should implement their commitments under the EU’s economic governance framework fully and without delay. This will help bring down budget deficits and debt ratios on a sustained basis, while prioritising growth-enhancing reforms and investment.
Inflation
Annual inflation increased to 2.4% in December 2024, up from 2.2% in November. As in the previous two months, the increase was expected and primarily reflected past sharp drops in energy prices falling out of the calculation. Along with a month-on-month increase in December, this pushed up energy prices slightly on an annual basis, after four consecutive declines. Food price inflation edged down to 2.6% and goods inflation to 0.5%. Services inflation edged up to 4.0%.
Most underlying inflation indicators have been developing in line with a sustained return of inflation to the Governing Council’s medium-term target. Domestic inflation, which closely tracks services inflation, has remained high, as wages and some services prices are still adjusting to the past inflation surge with a substantial delay. At the same time, recent signals point to continued moderation in wage pressures and to the buffering role of profits.
The Governing Council expects inflation to fluctuate around its current level in the near term. It should then settle sustainably at around the 2% medium-term target. Easing labour cost pressures and the continuing impact of the Governing Council’s past monetary policy tightening on consumer prices should help this process. While market-based indicators of inflation compensation have largely reversed the declines observed in autumn 2024, most measures of longer-term inflation expectations continue to stand at around 2%.
Risk assessment
The risks to economic growth remain tilted to the downside. Greater friction in global trade could weigh on euro area growth by dampening exports and weakening the global economy. Lower confidence could prevent consumption and investment from recovering as fast as expected. This could be amplified by geopolitical risks, such as Russia’s unjustified war against Ukraine and the tragic conflict in the Middle East, which could disrupt energy supplies and further weigh on global trade. Growth could also be lower if the lagged effects of monetary policy tightening last longer than expected. It could be higher if easier financing conditions and falling inflation allow domestic consumption and investment to rebound faster.
Inflation could turn out higher if wages or profits increase by more than expected. Upside risks to inflation also stem from the heightened geopolitical tensions, which could push energy prices and freight costs higher in the near term and disrupt global trade. Moreover, extreme weather events, and the unfolding climate crisis more broadly, could drive up food prices by more than expected. By contrast, inflation may surprise on the downside if low confidence and concerns about geopolitical events prevent consumption and investment from recovering as fast as expected, if monetary policy dampens demand by more than expected, or if the economic environment in the rest of the world worsens unexpectedly. Greater friction in global trade would make the euro area inflation outlook more uncertain.
Financial and monetary conditions
Market interest rates in the euro area have risen since the Governing Council’s meeting on 12 December 2024, partly mirroring higher rates in global financial markets. While financing conditions remain tight, the Governing Council’s interest rate cuts are gradually making it less expensive for firms and households to borrow.
The average interest rate on new loans to firms declined to 4.5% in November, while the cost of issuing market-based debt remained at 3.6%. The average rate on new mortgages edged down to 3.5%.
Growth in bank lending to firms rose to 1.5% in December, up from 1.0% in November, amid a strong monthly flow. Growth in debt securities issued by firms moderated to 3.2% in annual terms. Mortgage lending continued to rise gradually but remained muted overall, with an annual growth rate of 1.1%.
Credit standards for business loans tightened again in the fourth quarter of 2024, having broadly stabilised over the previous four quarters, as reported in the January 2025 bank lending survey. The renewed tightening mainly reflected banks becoming more concerned about the risks faced by their customers and less willing to take on risks themselves. Demand for loans by firms increased slightly in the fourth quarter but remained weak overall. Credit standards for mortgages were broadly unchanged, after three quarters of easing, while the demand for mortgages again increased strongly, mainly because of more attractive interest rates.
Monetary policy decisions
The interest rates on the deposit facility, the main refinancing operations and the marginal lending facility were decreased to 2.75%, 2.90% and 3.15% respectively, with effect from 5 February 2025.
The asset purchase programme and pandemic emergency purchase programme portfolios are declining at a measured and predictable pace, as the Eurosystem no longer reinvests the principal payments from maturing securities.
On 18 December 2024 banks repaid the remaining amounts borrowed under the targeted longer-term refinancing operations, thus concluding this part of the balance sheet normalisation process.
Conclusion
At its meeting on 30 January 2025, the Governing Council decided to lower the three key ECB interest rates by 25 basis points. In particular, the decision to lower the deposit facility rate – the rate through which the Governing Council steers the monetary policy stance – is based on its updated assessment of the inflation outlook, the dynamics of underlying inflation and the strength of monetary policy transmission. The Governing Council is determined to ensure that inflation stabilises sustainably at its 2% medium-term target. It will follow a data-dependent and meeting-by-meeting approach to determining the appropriate monetary policy stance. In particular, the Governing Council’s interest rate decisions will be based on its assessment of the inflation outlook in light of the incoming economic and financial data, the dynamics of underlying inflation and the strength of monetary policy transmission. The Governing Council is not pre-committing to a particular rate path.
In any case, the Governing Council stands ready to adjust all of its instruments within its mandate to ensure that inflation stabilises sustainably at its medium-term target and to preserve the smooth functioning of monetary policy transmission.
1 External environment
Over the review period from 12 December 2024 to 29 January 2025, global economic activity remained robust, albeit uneven across sectors and regions. Global trade growth moderated at the end of 2024, although the strong performance of US imports, possibly in the face of rising uncertainty about prospective trade policies, remained a major driver of global trade dynamics. Global headline inflation increased, largely due to higher energy prices, but core inflation continued to decline gradually.
Growth in global activity has remained robust, albeit uneven across sectors and regions, and this trend is expected to have continued at the start of 2025. In December 2024 the global composite output Purchasing Managers’ Index (PMI) (excluding the euro area) held steady at 53.2, unchanged from November (Chart 1). Solid growth in the services sector was offset by the continued weakness in manufacturing (the manufacturing output PMI stood at the neutral threshold of 50). This primarily reflects a downturn in the manufacturing cycle of advanced economies, where the output PMI dropped to 47.2. In emerging market economies, it remained above the neutral threshold despite a slight contraction compared with earlier months. Available industrial production data confirm these regional differences, with three-month-on-three-month changes indicating a marginal contraction in advanced economies and a moderate expansion in emerging market economies, leading to global manufacturing output growth of 1.1% in November. Overall, ECB nowcasting models point to steady quarter-on-quarter growth of around 1.0% in the fourth quarter of 2024 and 1.1% in the first quarter of 2025.
Chart 1
Global output PMI (excluding the euro area)
(diffusion indices)

Sources: S&P Global Market Intelligence and ECB staff calculations.
Note: The latest observations are for December 2024.
Global trade growth moderated at the end of 2024, although strong US import growth continued to provide some tailwinds. Overall, ECB nowcasting models point to average global trade growth of 0.7% in the fourth quarter of 2024 and the first quarter of 2025. This represents a moderation from the high average growth rates of 1.5% recorded in the second and third quarters of 2024, when fears over port strikes and concerns about supply chain disruptions ahead of the Christmas season, particularly in the United States, led to a surge in imports. While those fears subsequently receded to some extent, US imports remained strong at the end of the year, possibly amid uncertainty about trade policies under the new US Administration. Incoming port data for Los Angeles and Long Beach point to a considerable increase in the number of cargo vessels inbound from China in the second half of 2024 compared with the same period in the previous year. Taken together, the granular data suggest that US imports remained a major driver of global trade growth in the fourth quarter of 2024. Looking ahead, while efforts to anticipate potential trade restrictions may continue to support trade at the start of the first quarter of 2025, headwinds – including new tariffs and an unwinding of the observed frontloading of imports – may later materialise. Manufacturing new export orders declined in December 2024, pointing to ongoing weakness in the manufacturing cycle and tentative signs of a slowdown in global trade growth.
Headline inflation across the member countries of the Organisation for Economic Co-operation and Development (OECD) has increased, but core inflation continues to decline. In November 2024 the annual rate of consumer price index (CPI) inflation across OECD members (excluding Türkiye) rose to 2.7%, up from 2.6% in the previous month (Chart 2). This uptick in headline inflation was largely due to higher energy prices, with the contribution of food prices remaining broadly stable. However, core inflation, which excludes energy and food prices, eased slightly to 3.1%, continuing to return slowly to historical averages. Looking ahead, growing imports and shipping demand have started to affect shipping rates, which began to increase in the last quarter of 2024 but are still below their peak level reached in July that year. Overall, renewed upside risks to inflation remain contained in the near term.
Chart 2
OECD CPI inflation
(year-on-year percentage changes)
Sources: OECD and ECB staff calculations.
Notes: The OECD aggregate excludes Türkiye and is calculated using OECD CPI annual weights. The latest observations are for November 2024.
Over the review period from 12 December 2024 to 29 January 2025, Brent crude oil prices climbed by 4.7%, while European gas prices increased by 14.6%. The oil price increase was mainly fuelled by supply factors as a result of recent US sanctions targeting Russian oil flows and early signs of friction in relation to Iranian exports. The rise in European gas prices was attributable to a combination of supply and demand factors. On the supply side, the end of the transit agreement between Russia and Ukraine pushed up prices, even though it was largely expected. Supply pressures were also compounded by outages at a Norwegian liquefied natural gas plant. On the demand side, colder than usual temperatures in late December drove an increase in consumption. As a result, European gas storage at the end of 2024 had fallen below the year-end levels recorded in 2022 and 2023 and before the energy crisis. Metal prices remained stable throughout the review period, as precautionary metal-intensive imports from China offset longer-term uncertainty surrounding US tariff policies. Food prices increased by 5.9%, owing to higher prices for corn and cocoa.
Activity in the United States remains robust, although the inflation outlook has become more uncertain. Real GDP decelerated in the last quarter of 2024 but remained robust, at 0.6% quarter on quarter, down from 0.8% in the previous quarter.[1] Personal consumption expenditures (PCE) continued to drive domestic demand, which increased further for both goods and services, owing mainly to higher real disposable incomes. By contrast, private investment put a drag on activity, as non-residential investment fell quarter on quarter as a result of lower contributions from transportation and information equipment, although these were largely offset by an increase in residential investment. The US labour market continues to cool but remains resilient. US non-farm payroll employment rose by 256,000 jobs in December, on the back of a volatile last quarter of 2024 impacted by hurricanes and strikes. Overall, 2.2 million jobs were added in 2024, down from the expansion of 3 million recorded in 2023. The unemployment rate edged down to 4.1% in December from 4.2% in November, while the participation rate remained unchanged at 62.5%, with little fluctuation over the year. Wage growth fell slightly to 3.9% year on year, continuing to approach the range of 3% to 3.5% that the Federal Reserve System considers to be consistent with its inflation target. US headline PCE inflation for November climbed to 2.4% due to higher energy prices, while core PCE inflation remained at 2.8%, with core services declining to 2.5%. The December CPI points to a slight increase in headline PCE inflation and a further decrease in core PCE inflation in the near term. Overall, key sources of inflation are cooling in the United States, as wage growth is expected to remain on a downward path and rents have continued to decline overall. At the Federal Open Market Committee (FOMC) meeting on 29 January 2025, FOMC members were of the view that downside risks to the labour market had lessened amid increased uncertainty about the inflation outlook, particularly with regard to the impact of the proposed changes to trade and immigration policy.
Chinese activity rebounded at the end of 2024, but domestic demand remains weak. Quarterly GDP growth increased to 1.6% in the fourth quarter of 2024, up from 1.3% in the previous quarter. Monthly indicators for December highlighted that the recovery in GDP and industrial production was mainly driven by a government programme to trade in consumer goods in return for discounts on new products of the same type, and a surge in exports. In spite of the latest improvement, retail sales remain subdued as persistently negative consumer confidence continues to weigh on a broader spending recovery. Recent policy announcements signal increased fiscal and monetary support this year. Meanwhile, the property market is showing some localised signs of stabilisation, although the main indicators are still weak. Exports have continued to grow, mainly to the United States, although Chinese exporters are increasingly concerned about rising trade uncertainty. In December consumer price inflation in China decelerated further to 0.1%, down from 0.2% in November, while producer price inflation remained in negative territory. On average, producer prices contracted by 2.2% in 2024, resulting in significant downward momentum in Chinese export prices.
Activity in the United Kingdom remains weak amid persistent inflation. The UK economy remained sluggish in the fourth quarter of 2024. After an unexpected decline in October, UK real GDP growth increased marginally in November, bringing it to zero in the three months to November. This follows already flat growth in the third quarter. Headline CPI inflation eased slightly to 2.5% in December, down from 2.6% in November, partly reflecting lower services inflation. Inflation is expected to remain above target throughout 2025, boosted by increased public spending and higher taxes on employment, as well as the continued unwinding of energy-related base effects. In line with the forecast rise in inflation, firms’ expectations for price growth over the coming year went up in November and December. This trend aligns with an uptick in households’ inflation expectations, which could be contributing to persistent domestic inflationary pressures. At its December meeting, the Bank of England kept its policy rate at 4.75%.
2 Economic activity
Euro area output stagnated in the fourth quarter of 2024. Although the expenditure breakdown is not yet available, short-term indicators point to positive contributions from private and public consumption, which were largely offset by falling investment, alongside a broadly neutral net trade contribution. On the sectoral side, it is likely that the industrial sector continued to contract at the end of 2024 while services showed moderate growth. Survey data signal a continued moderate services-led expansion in the first quarter of 2025. At the same time, these indicators suggest ongoing weakness in the industrial sector amid subdued demand for goods, the impact of the past monetary policy tightening and significant trade policy uncertainty. This weakness is currently reflected in contracting labour demand in the sector. Euro area activity is expected to strengthen over the medium term. Growth should be supported by a pick-up in consumption, owing to still resilient labour markets and declining inflation. Strengthening foreign demand and the fading dampening effects of past monetary policy tightening should also underpin growth going forward. However, the economic outlook is surrounded by high uncertainty.
Euro area output stagnated in the fourth quarter of 2024, according to Eurostat’s preliminary flash estimate (Chart 3). Real GDP displayed no growth, quarter on quarter, in the fourth quarter, following positive growth in the previous three quarters of the year.[2] In 2024 as a whole, GDP is estimated to have risen by 0.7%.[3] Although the expenditure breakdown is not yet available, short-term indicators and available country data point to positive contributions from private and public consumption, which were offset by falling investment, while the contribution from net exports was broadly neutral. At the same time, the industrial sector likely remained weak, while the services sector was more resilient. Growth dynamics in the fourth quarter continued to be uneven among the largest euro area economies: GDP increased by 0.8%, quarter on quarter, in Spain, while declining by 0.2% in Germany and by 0.1% in France, and remaining flat in Italy. At the same time, output contracted by 1.3% in Ireland. The fourth quarter outcome for the euro area generates a carry-over effect of 0.3% for annual growth in 2025.[4]
Chart 3
Euro area real GDP, composite output PMI and ESI
(left-hand scale: quarter-on-quarter percentage changes; right-hand scale: diffusion index)

Sources: Eurostat, European Commission and S&P Global.
Notes: The two lines indicate monthly developments; the bars show quarterly data. The European Commission’s Economic Sentiment Indicator (ESI) has been standardised and rescaled to have the same mean and standard deviation as the composite output Purchasing Managers’ Index (PMI). The latest observations are for the fourth quarter of 2024 for real GDP, January 2025 for the composite output PMI and December 2024 for the ESI.
Survey data signal a continued moderate services-led expansion in the first quarter of 2025. Although economic data with a bearing on the first quarter are scarce, the latest Purchasing Managers’ Index (PMI) offers some preliminary indications of developments at the start of the year. The composite output PMI stood at 50.2 in January, up from an average 49.3 in the fourth quarter of 2024. Across sectors, the PMI indicator for manufacturing output remained in contractionary territory in January, although it improved vis-à-vis the fourth quarter of 2024 (Chart 4, panel a). The new orders index, which should be more forward looking, has shown a similar pattern. Overall, these indicators suggest continued weakness in the industrial sector going forward amid subdued demand for goods and the impact of past monetary policy tightening. PMI data for the services sector, which has so far led the recovery in activity, continue to point to positive growth in both activity and new business (Chart 4, panel b). Movements in the PMI suggest that the recent sectoral differences are likely to persist in the short term. The main findings from the ECB’s recent contacts with non-financial companies point to subdued business momentum in the near term, with flat or declining manufacturing output alongside more resilient growth in services activity (see Box 5). Widespread economic policy uncertainty is also expected to weigh on the growth outlook for early 2025. Although this short-term narrative is echoed by the most recent ECB Survey of Professional Forecasters (conducted in January), respondents still see a gradual recovery in economic activity in the coming quarters.
Chart 4
PMIs across sectors of the economy
a) Manufacturing | b) Services |
|---|---|
(diffusion indices) | (diffusion indices) |
 |  |
Source: S&P Global Market Intelligence.
Note: The latest observations are for January 2025.
The unemployment rate remains low despite signs of a gradual slowdown in the labour market. The unemployment rate stood at a record low of 6.3% in November, unchanged from October (Chart 5). A shift in the composition of the labour force towards older and more highly educated workers has been one of the factors behind this decline over the past two years (see Box 3). Nevertheless, the labour market continues to show signs of gradual cooling. Growth in the labour force, which has been a key driver of employment growth in the post-pandemic period, likely stabilised in the fourth quarter of 2024 at a lower rate than in recent quarters, but it is still elevated compared with average rates up to 2019. At the same time, labour demand is softening. The number of unfilled vacancies on the online job listings website Indeed remained significantly lower than in early 2024, while the number of new job postings declined throughout December.
Chart 5
Euro area employment, PMI assessment of employment and unemployment rate
(left-hand scale: quarter-on-quarter percentage changes, diffusion index; right-hand scale: percentages of the labour force)

Sources: Eurostat, S&P Global Market Intelligence and ECB calculations.
Notes: The two lines indicate monthly developments, while the bars show quarterly data. The PMI is expressed in terms of the deviation from 50, then divided by ten. The latest observations are for the third quarter of 2024 for employment, January 2025 for the PMI assessment of employment and November 2024 for the unemployment rate.
Short-term indicators suggest that the labour market will continue to cool in the first quarter of 2025. The monthly composite PMI employment indicator increased from 49.2 in December to 49.8 in January, remaining around the neutral threshold of 50 points (Chart 5). The composite outturn masked different developments across sectors. Perceptions of employment growth became more negative in the manufacturing sector, while they rebounded into expansionary territory in the services sector. The PMI for employment in the services sector, however, remains well below its 2024 average. This evidence of a muted outlook for employment provided by the PMIs is consistent with the findings from the ECB’s recent contacts with non-financial companies (see Box 5). Overall, weaker employment dynamics should support a gradual recovery in labour productivity going forward.
Real private consumption increased by 0.7% in the third quarter of 2024, reflecting robust income growth and a decline in the elevated household saving rate. Following an average increase of 0.1% in the previous four quarters, household spending was boosted by strong demand for services in the third quarter of 2024, partly related to temporary factors (e.g. the Paris 2024 Olympic and Paralympic Games) (Chart 6, panel a). The moderation in food and energy inflation contributed to a rebound in the consumption of goods as well. The household saving rate declined but remained elevated at 15.2% in the third quarter – reflecting the positive effect on savings of the ongoing rise in real income, the still tight financing conditions, subdued confidence and high uncertainty (Chart 6, panel b). Household income growth continued to be driven by strong labour compensation.
Chart 6
Household income, consumption and savings
a) Real private consumption | b) Income and savings |
|---|---|
(quarter-on-quarter percentage changes and percentage point contributions) | (quarter-on-quarter percentage changes and percentage point contributions; percentage of gross disposable income) |
 |  |
Sources: Eurostat, European Commission and ECB calculations.
Notes: In panel a), real private consumption refers to the national concept and the components refer to the domestic concept of consumption. The latest observations are for the third quarter of 2024. In panel b), labour income is calculated as compensation of employees, while non-labour income includes income from self-employment, net interest income, dividends and rents; fiscal income is measured as a residual. The latest observations are for the third quarter of 2024.
Household spending growth likely moderated at the turn of the year, also reflecting the unwinding of the temporary factors seen in the third quarter. The volume of retail sales displayed weak dynamics early in the fourth quarter of 2024, suggesting a likely moderation in private consumption growth at the end of the year. Surveys also point to ongoing, albeit more moderate, household spending growth at the turn of the year. The European Commission’s consumer confidence indicator edged up in January 2025 (Chart 7) but remained subdued owing to weak expectations about the general economy and households’ financial situations over the next 12 months amid still elevated uncertainty. Business expectations for contact-intensive services dropped below their historical average in December 2024, suggesting a moderation in services demand in the first quarter of 2025. By contrast, retail trade expectations for the next three months improved further in December and the ECB’s latest Consumer Expectations Survey points to planned spending on holidays for the next 12 months still being robust. While consumer expectations for major purchases in the next 12 months moderated in December, they remained in line with their pre-pandemic average. Overall, the improvements in households’ purchasing power and real income perceptions should be the main drivers of the continuing private consumption growth (see Box 2).
Chart 7
Consumer confidence and expectations
(standardised percentage balances)

Sources: Eurostat, European Commission and ECB calculations.
Notes: Business expectations for demand in contact-intensive services and retail trade expectations refer to the next three months, while consumer expectations for major purchases refer to the next 12 months. The first series is standardised for the period January 2005-19, owing to data availability, whereas the other three series on the chart are standardised for the period 1999-2019. “Contact-intensive services” include accommodation, travel and food services. The latest observations are for January 2025 for consumer confidence and for December 2024 for the remaining items.
Business investment remained muted around the turn of the year. Business investment (proxied by non-construction investment excluding Irish intangibles) contracted by 1.2%, quarter on quarter, in the third quarter of 2024, amid high volatility. At the same time, investment in machinery declined for the third quarter in a row and transport investment fell back, following a modest rebound in the first half of the year. Intangible investment continued to expand at a moderate pace. In the capital goods sector, output and new orders fell further in the fourth quarter, while industrial confidence among capital goods producers declined sharply to a low not seen since 2020 (Chart 8, panel a). Wider survey data – released mainly at the end of 2024 – do not suggest an imminent pick-up in business investment at the start of 2025, although more forward-looking surveys anticipate improvements ahead. Earnings calls for the fourth quarter of 2024 suggest an ongoing deterioration in both investment sentiment and profit sentiment since the start of 2024. PMI production expectations for the coming 12 months and capacity utilisation indicators for the wider economy released by the European Commission’s Directorate General for Economic and Financial Affairs (ECFIN) remained well below typical levels consistent with investment growth in December. The ECB’s recent contacts with non-financial companies also reported downbeat expectations at the start of the year, with a strong focus on rationalisation and reducing the carbon footprint where investment remains strong (see Box 5). The Sentix investor confidence indicator fell to a 27-month low in January amid reports of rising bankruptcies and significant geopolitical, trade and policy uncertainty, although the six-month ahead indicator is less pessimistic and points to an improving outlook. Similarly, the latest ECFIN investment survey anticipates modest growth in annual business investment in 2025.
Chart 8
Real private investment dynamics and survey data
a) Business investment | b) Housing investment |
|---|---|
(quarter-on-quarter percentage changes; diffusion indices and percentage balances) | (quarter-on-quarter percentage changes; diffusion index and percentage balances) |
 |  |
Sources: Eurostat, European Commission (EC), S&P Global Market Intelligence and ECB calculations.
Notes: The lines indicate monthly developments, while the bars refer to quarterly data. The PMIs are expressed in terms of the deviation from 50. In panel a), business investment refers to non-construction investment excluding Irish intangibles. Monthly data reflect the capital goods sector. The latest observations are for the third quarter of 2024 for business investment and December 2024 for the PMIs and the European Commission’s confidence indicator. In panel b), the line for the European Commission’s activity trend indicator refers to the building and specialised construction sector’s assessment of the trend in activity over the preceding three months. The latest observations are for the third quarter of 2024 for housing investment and December 2024 for the PMI and the European Commission’s indicator.
Housing investment fell once again in the third quarter of 2024, albeit at a slower pace compared with previous quarters. Housing investment declined by 0.2%, quarter on quarter, in the third quarter, thus significantly moderating the downward trend which started in the second quarter of 2022 (Chart 8, panel b). In the fourth quarter, building construction output in October and November stood, on average, above its level in the third quarter. However, residential building permits remained at a historical low, suggesting that there were limited pressures from projects in the pipeline. Moreover, survey-based activity measures, such as the PMI for residential construction output and the European Commission’s indicator for building and specialised construction activity in the last three months, remained subdued up to December. Overall, this suggests that housing investment is likely to have broadly stagnated in the fourth quarter. Looking ahead, recent ECB surveys point to some favourable developments in the outlook for housing investment in the coming quarters. In the Consumer Expectations Survey, household expectations for the housing market, as reflected by the attractiveness of housing as a good investment, have broadly reached their average levels. The January bank lending survey indicates that demand for housing loans is expected to continue to improve in the first quarter of 2025 (see Section 5, “Financing conditions and credit developments”).
Euro area exports contracted in November 2024 amid persistent competitiveness challenges. Export orders for both manufacturing and services continued to fall in December. The weakness in export growth reflects the continuation of a broader trend of declining euro area market shares amid persistent competitiveness issues for euro area manufacturers (including the medium-high tech and high tech sectors) and increasing competition from China (see Box 5). Meanwhile, imports rose by 1.1% in November in three-month-on-three-month terms, in line with the continued modest growth in consumption in the fourth quarter.
Overall, euro area activity is expected to strengthen over the medium term. Growth should be supported by a pick-up in consumption, owing to still resilient labour markets and declining inflation. Strengthening foreign demand and the fading dampening effects of past monetary policy tightening are factors that should also underpin growth going forward. However, the economic outlook is surrounded by high uncertainty, with geopolitics and trade tensions representing downside risks.
3 Prices and costs
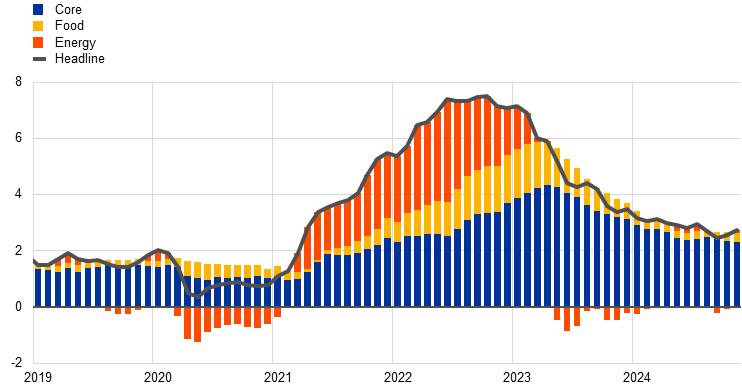
Euro area headline inflation rose to 2.4% in December 2024, up from 2.2% in November.[5] This rise was expected and mainly due to base effects in energy price developments. Inflation is expected to fluctuate around its current level in the near term. Overall, indicators of underlying inflation are developing in line with a sustained return to the ECB’s 2% medium-term target for headline inflation. The indicator of domestic inflation remains high, reflecting strong wage growth and the fact that prices in certain sectors are still adjusting to the past inflation surge with a substantial delay. However, wage growth is moderating as expected, and profits are partially buffering their impact on inflation. Measures of longer-term inflation expectations were broadly unchanged at around 2%, while measures of shorter-term inflation expectations increased.
Euro area headline inflation, as measured in terms of the Harmonised Index of Consumer Prices (HICP), increased to 2.4% in December from 2.2% in November (Chart 9). The increase was mainly driven by higher energy inflation and a small rise in services inflation. The inflation outcome for the fourth quarter of 2024 was slightly below the December 2024 Eurosystem staff macroeconomic projections for the euro area. This is despite oil and gas commodity prices being higher than foreseen in the December 2024 projections.
Chart 9
Headline inflation and its main components
(annual percentage changes; percentage point contributions)

Sources: Eurostat and ECB calculations.
Notes: “Goods” refers to non-energy industrial goods. The latest observations are for December 2024.
Energy inflation increased from -2.0% in November to 0.1% in December 2024. This increase was due to higher annual growth rates for electricity and transport fuel prices, while the growth rate for gas prices declined slightly. The higher rate of change for energy inflation also reflects an upward base effect from the significant decrease in energy prices in December 2023.
Food inflation decreased slightly to 2.6% in December 2024, down from 2.7% the month before. Unprocessed food inflation declined to 1.6% in December from 2.3% in November. This was mainly due to lower prices for fruit and vegetables. However, this decline was partly offset by an increase in processed food inflation (2.9% in December, up from 2.8% in November), driven by a strong surge in tobacco prices. The inflation rate for processed food excluding tobacco remained below 2%.
HICP inflation excluding energy and food (HICPX) remained unchanged in December, standing at 2.7% for the fourth consecutive month. Non-energy industrial goods (NEIG) inflation continued to hover around its long-term average, edging down to 0.5% in December from 0.6% in November. This decrease was offset by slightly higher services inflation (4.0% in December after 3.9% in November). In contrast to NEIG inflation, services inflation remained well above its long-term average of 1.9%, reflecting the impact of still elevated wage pressures on some of its items and the effects of lagged repricing on others. The slight drop in NEIG inflation in December was driven by a decline in the rates of semi-durable and durable goods inflation, while the inflation rate for non-durable goods remained unchanged. The rise in services inflation was mainly driven by higher annual rates for recreation and transport services.
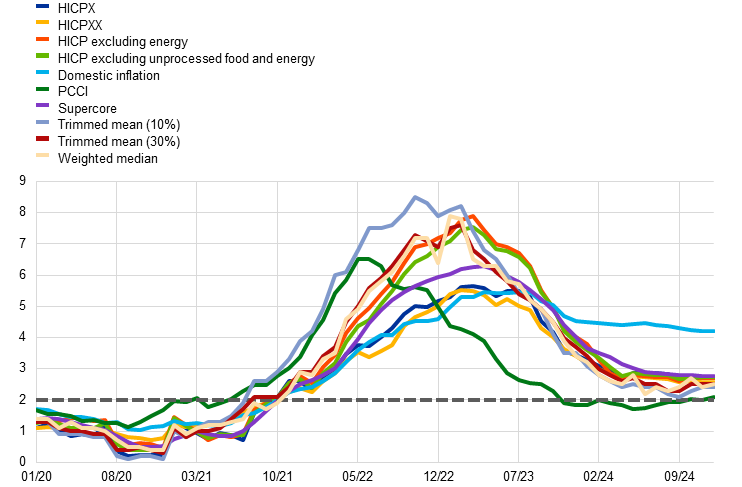
Most underlying inflation indicators have been developing in line with a sustained return of headline inflation to the 2% medium-term target (Chart 10). Their values remained broadly stable in December 2024, ranging from 2.0% to 2.8%.[6] Most exclusion-based measures were unchanged in December, including the 10% and 30% trimmed means, HICPX inflation excluding travel-related items, clothing and footwear (HICPXX) and HICP inflation excluding unprocessed food and energy. At the same time, the weighted median marginally increased to 2.5% in December from 2.4% in November. The indicator of domestic inflation, which mostly covers services items, was unchanged at 4.2% in December. Regarding model-based measures, the Supercore indicator (which comprises HICP items sensitive to the business cycle) was also unchanged, standing at 2.8%, while the Persistent and Common Component of Inflation (PCCI) increased slightly to 2.1% in December, up from 2.0% in November.
Chart 10
Indicators of underlying inflation
(annual percentage changes)
Sources: Eurostat and ECB calculations.
Notes: The grey dashed line represents the ECB’s inflation target of 2% over the medium term. The latest observations are for December 2024.
Most indicators of pipeline pressures for goods inflation remained subdued in November (Chart 11). At the early stages of the pricing chain, producer price inflation for domestic sales of intermediate goods was still negative, but less so than in the previous month (-0.3% in November 2024 after -0.5% in October). In the later stages of the pricing chain, the annual growth rates of producer prices for non-food consumer goods decreased slightly to 1.1% in November from 1.3% in October. The annual growth rate of producer prices for manufactured food increased further to 1.5% from 1.3% over the same period, confirming previous indications that the gradual easing of pipeline pressures has been fading out in this segment. The annual growth rate of import prices for non-food consumer goods moved upwards but remained moderate overall. Meanwhile, import price inflation for manufactured food increased further to 6.8% in November from 4.9% in October, possibly reflecting the surge in international food commodity prices since early 2024. The stronger import price dynamics also reflected the fact that the year-on-year rate of the nominal effective exchange rate of the euro had declined in November 2024. However, in October 2024 the rate was broadly unchanged compared with October 2023.
Chart 11
Indicators of pipeline pressures
(annual percentage changes)

Sources: Eurostat and ECB calculations.
Note: The latest observations are for November 2024.
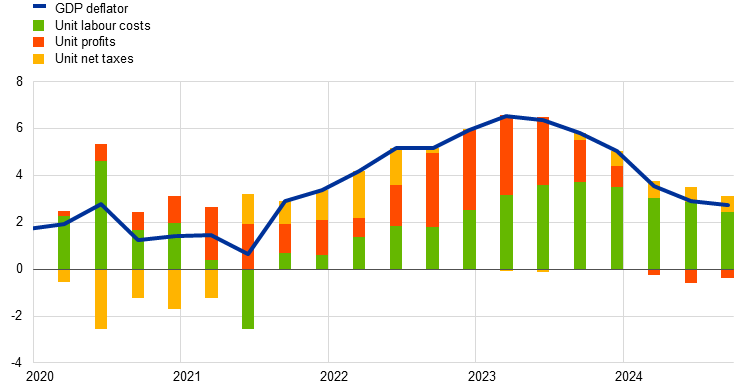
Domestic cost pressures, as measured by growth in the GDP deflator, fell further to 2.7% in the third quarter of 2024, down from 2.9% in the previous quarter (Chart 12). This represents a significant decrease from the peak of 6.4% in the first quarter of 2023, although the rate has remained above its long-term average of 1.6% before the COVID-19 pandemic. The easing of GDP deflator dynamics mainly reflected a further moderation in unit labour costs growth (4.4% in the third quarter of 2024, down from 5.2% in the second quarter). This, in turn, was driven by lower wage growth, when measured in terms of both compensation per employee and compensation per hour. This moderation in actual wage growth concealed higher negotiated wage growth, which temporarily rose to 5.4% in the third quarter of 2024 (up from 3.5% in the second quarter). While the contribution of unit profits to the GDP deflator was less negative in the third quarter, their role in buffering labour costs is still elevated. Looking forward, the ECB’s wage tracker, which includes data on wage agreements negotiated up to the end of December 2024, points to an easing of wage growth pressures. This observation is also confirmed by the latest survey indicators on wage growth, such as the ECB’s Corporate Telephone Survey, which expects wage growth to decrease from 4.3% in 2024 to 3.6% in 2025.[7] The easing of wage growth pressures would be in line with reduced inflation compensation pressures and the cooling of labour demand.
Chart 12
Breakdown of the GDP deflator
(annual percentage changes; percentage point contributions)
Sources: Eurostat and ECB calculations.
Notes: Compensation per employee contributes positively to changes in unit labour costs. Labour productivity contributes negatively. The latest observations are for the third quarter of 2024.
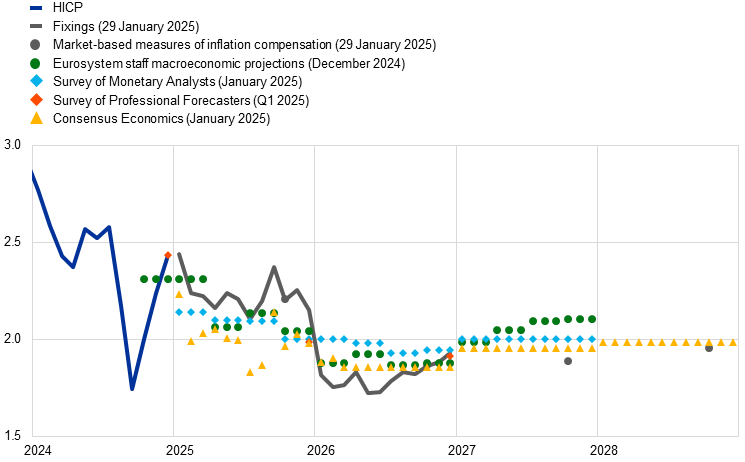
Survey-based indicators of longer-term inflation expectations and market-based measures of longer-term inflation compensation remained stable, with most standing at around 2% (Chart 13). In both the ECB Survey of Monetary Analysts (SMA) for January 2025 and the ECB Survey of Professional Forecasters (SPF) for the first quarter of 2025, median and average longer-term inflation expectations were unchanged at 2%. Longer-term market-based measures of inflation compensation (based on HICP excluding tobacco) increased slightly over the review period, with the five‑year forward inflation-linked swap rate five years ahead standing at around 2.1%. However, after adjusting for model-based estimates of inflation risk premia, market participants expect longer-term inflation to be around 2%.
Market-based measures of near-term euro area inflation compensation, as measured by inflation fixings, have largely reversed the declines observed in autumn 2024 (Chart 13). These measures – reflecting market participants’ expectations for HICP inflation excluding tobacco – suggest that investors expect inflation to remain just above 2.0% for the rest of 2025 before settling near 2.0% around the turn of the year and into early 2026. In the medium term, the one-year forward inflation-linked swap rate starting one year ahead remained broadly unchanged at around 1.8% over the review period. On the consumer side, the December 2024 ECB Consumer Expectations Survey (CES) reported that the median rate of perceived inflation over the previous 12 months increased slightly from 3.4% in November to 3.5% in December. Median expectations for headline inflation over the next year also increased, to 2.8% in December from 2.6% in November. Meanwhile, median expectations for headline inflation three years ahead remained unchanged at 2.4%. The increase in consumer inflation expectations since September 2024 is linked to stronger perceptions of past inflation on average and higher inflation uncertainty for some respondents.
Chart 13
Headline inflation, inflation projections and expectations
a) Headline inflation, market-based measures of inflation compensation, inflation projections and survey-based indicators of inflation expectations
(annual percentage changes)
b) Headline inflation and ECB Consumer Expectations Survey
(annual percentage changes)

Sources: Eurostat, LSEG, Consensus Economics, ECB (SMA, SPF, CES), Eurosystem staff macroeconomic projections for the euro area, December 2024 and ECB calculations.
Notes: In panel a), the market-based measures of inflation compensation series are based on the one-year spot inflation rate, the one-year forward rate one year ahead, the one-year forward rate two years ahead and the one-year forward rate three years ahead. The observations for market-based measures of inflation compensation are for 29 January 2025. Inflation fixings are swap contracts linked to specific monthly releases in euro area year-on-year HICP inflation excluding tobacco. The SPF for the first quarter of 2025 was conducted between 7 and 9 January 2025. The cut-off date for the Consensus Economics long-term forecasts was 13 January 2025. The cut-off date for data included in the Eurosystem staff macroeconomic projections was 20 November 2024. In panel b), for the CES, the dashed lines represent the mean and the solid lines represent the median. The latest observations are for December 2024.
4 Financial market developments
Over the review period from 12 December 2024 to 29 January 2025 the risk-free euro short-term rate (€STR) forward curve experienced an overall upward shift with some intermittent fluctuations. At the start of the period, the forward curve shifted downward. However, this trend reversed around the turn of the year and into early January, driven by rising energy prices and new data releases for the US economy, which prompted upward revisions in inflation expectations and contributed to the rebound in the forward curve. As a result, at the end of the review period, markets were pricing in 90 basis points of cumulative interest rate cuts in the euro area by the end of 2025. Long-term sovereign bond yields also rose, by slightly more than risk-free rates. In equity markets, euro area stock prices increased as improved risk sentiment offset the impact of rising risk-free rates, while US stocks declined overall, primarily as a result of a decrease in equity prices in the IT sector. Meanwhile, in euro area corporate bond markets, spreads narrowed for both investment-grade and high-yield issuers. In the foreign exchange market, the euro depreciated moderately against the US dollar and remained broadly stable in trade-weighted terms.
Euro area near-term risk-free rates increased in the review period following the December Governing Council meeting. The benchmark €STR averaged 3.0% over the review period, following the Governing Council’s widely anticipated decision to lower the key ECB interest rates by 25 basis points at its December meeting. Excess liquidity was broadly stable, increasing by approximately €22 billion to €2,923 billion. This mainly reflected the fact that the repayments in December of funds borrowed in the third series of targeted longer-term refinancing operations (TLTRO III) and the decline in the portfolios of securities held for monetary policy purposes, with the Eurosystem no longer reinvesting the principal payments from maturing securities in its asset purchase programmes, were offset by a decrease in liquidity-absorbing net autonomous factors. After an initial decline, short-term rate expectations priced into the forward curve started to rise at around the turn of the year and into early January, as market participants revised their inflation outlook following an increase in energy prices. Euro area financial markets also reacted to the better than expected macroeconomic data releases for the US economy and to expectations of a slower future pace of interest rate cuts by the US Federal Open Market Committee (FOMC). In the euro area, the overnight index swap (OIS) forward curve, which is based on the €STR, increased by 7 basis points for one-year maturities and 24 basis points for two-year maturities, reflecting expectations of a slower pace of monetary policy easing in the euro area. By the end of the review period, markets were pricing in cumulative interest rate cuts of 90 basis points by the end of 2025, 33 basis points less than at the start of the period. Longer-term euro area risk-free rates also rose during the review period. The ten-year nominal OIS rate reached 2.4%, an overall increase of 32 basis points.
Long-term euro area sovereign bond yield spreads relative to risk-free rates increased slightly (Chart 14). The ten-year GDP-weighted euro area sovereign bond yield closed the review period at 3.0%, an increase of 35 basis points from its initial level. This resulted in a 4 basis point widening of the spread relative to the OIS rate. Sovereign bond spreads widened across jurisdictions, with a relatively narrow dispersion across most countries. Internationally, the ten-year US Treasury yield rose by 20 basis points to 4.5%, while the ten-year UK sovereign bond yield climbed by 25 basis points, reaching 4.6%.
Chart 14
Ten-year sovereign bond yields and the ten-year OIS rate based on the €STR
(percentages per annum)

Sources: LSEG and ECB calculations.
Notes: The vertical grey line denotes the start of the review period on 12 December 2024. The latest observations are for 29 January 2025.
Euro area equity prices ended the review period at somewhat higher levels. Despite the increase in interest rates, broad stock market indices climbed by 4.6% following an initial decline, supported by improved risk sentiment amid very few notable surprises in macroeconomic data. Corresponding stock market indices in the Unites States declined marginally, by 0.2%, reflecting the shift in market participants’ monetary policy outlook. In the euro area, equity prices of non-financial corporations rose by 3.6%, while those of banks and other financial corporations gained 10.9% and 8.1% respectively. In the United States, equity prices of banks and other financial corporations increased by 6.6% and 3.1%, while those of non-financial corporations declined by 0.5%. The decrease in non-financial corporation equity prices was primarily driven by a decline in the IT sector.
Corporate bond spreads narrowed in both the investment-grade and high-yield segments. The positive market sentiment was also reflected in corporate bond spreads, which, amid some volatility, narrowed in both the investment-grade segment and the high-yield segment by 5 basis points overall. The narrowing in the investment-grade segment was driven by a decrease of 7 basis points in spreads on bonds issued by financial corporations, while spreads on non-financial corporation bonds declined by 4 basis points.
In foreign exchange markets, the euro depreciated moderately against the US dollar and remained broadly stable in trade-weighted terms (Chart 15). The nominal effective exchange rate of the euro – as measured against the currencies of 41 of the euro area’s most important trading partners – was broadly stable (declining by 0.2%) during the review period, given offsetting developments in the exchange rates against key currencies. The depreciation of the euro against the US dollar (by 0.9%) was largely driven by factors specific to the United States, such as the market reaction to the December FOMC meeting, robust US macroeconomic data releases and the anticipation of the economic policies of the incoming US Administration. The euro weakened by 1.2% against the Chinese renminbi, while the latter also weakened against the US dollar, albeit to a lesser extent. Conversely, the euro appreciated by 1.6% against the pound sterling amid growing expectations of future rate cuts by the Bank of England, weaker incoming economic data in the United Kingdom and uncertainty over the government budget outlook. Following a sustained appreciation for most of 2024, the Swiss franc depreciated by 1.2% against the euro after a larger than expected interest rate cut by the Swiss National Bank in December. The euro also appreciated by 1.2% against the Japanese yen. Over the review period the euro was little changed against most other major advanced and emerging market currencies.
Chart 15
Changes in the exchange rate of the euro vis-à-vis selected currencies
(percentage changes)
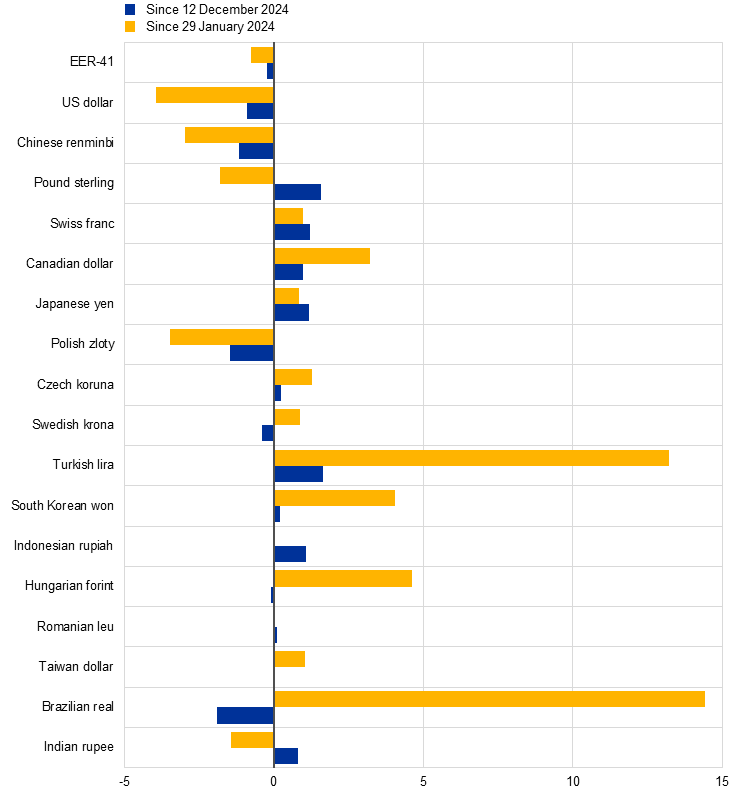
Source: ECB calculations.
Notes: EER-41 is the nominal effective exchange rate of the euro against the currencies of 41 of the euro area’s most important trading partners. A positive (negative) change corresponds to an appreciation (depreciation) of the euro. All changes have been calculated using the foreign exchange rates prevailing on 29 January 2025.
5 Financing conditions and credit developments
While financing conditions remain tight, ECB policy rate cuts are gradually making it less expensive for firms and households to borrow. In November 2024 bank funding costs and bank lending rates continued their gradual decline from peak levels. The average interest rates on new loans to firms and on new mortgages fell in November to 4.5% and 3.5% respectively. Growth in loans to firms and households increased in December but remained weak, reflecting still subdued demand and tight credit standards. Over the period from 12 December 2024 to 29 January 2025, the cost to firms of market-based debt financing increased while the cost of equity financing fell, reflecting the higher long-term risk-free interest rate and the lower equity risk premium. According to the January 2025 euro area bank lending survey, credit standards for loans to firms tightened in the fourth quarter of 2024, driven by higher perceived risks and lower risk tolerance. Credit standards remained unchanged for housing loans, after three quarters of easing. Housing loan demand rebounded strongly, while loan demand by firms remained weak. In the latest Survey on Access to Finance of Enterprises (SAFE) for the fourth quarter of 2024, firms reported a fall in bank interest rates and a further slight tightening of other loan conditions. Firms also indicated that there had been no change in the need for bank loans and a small reduction in bank loan availability. The annual growth rate of broad money (M3) declined slightly to 3.5% in December.
Euro area bank funding costs continued to gradually retreat from their peak levels, reflecting the ECB’s recent policy rate cuts and the expected interest rate path. The composite cost of debt financing for euro area banks edged down in November 2024, standing at 1.9% (Chart 16, panel a). While the lower bank funding costs resulted primarily from a fall in bank bond yields (Chart 16, panel b), data available until 29 January show that a repricing of risk-free rates has put upward pressure on bank bond yields recently. Average deposit rates fell further, with the composite deposit rate standing at 1.2% in November, driven by diminishing interest rates on time deposits for firms and households. In contrast, rates on overnight deposits and deposits redeemable at notice remained broadly unchanged.
Bank balance sheets have been robust overall, despite a weak economic environment. In the third quarter of 2024, bank capitalisation remained broadly stable with capital ratios well above 15% and voluntary capital buffers exceeding Common Equity Tier 1 (CET1) requirements. Bank profitability remained at a high level in the third quarter of 2024, although downward pressure on earnings on floating rate assets will become a headwind for interest income as credit losses start to rise. Non-performing loans stayed broadly unchanged, being close to the historical lows seen in the first quarter of 2023. However, the proportion of underperforming (i.e. Stage 2) loans increased somewhat in 2024, especially as regards small firms and commercial real estate, pointing to worsening asset quality and higher provisioning costs for banks looking ahead.
Chart 16
Composite bank funding costs in selected euro area countries
(annual percentages)
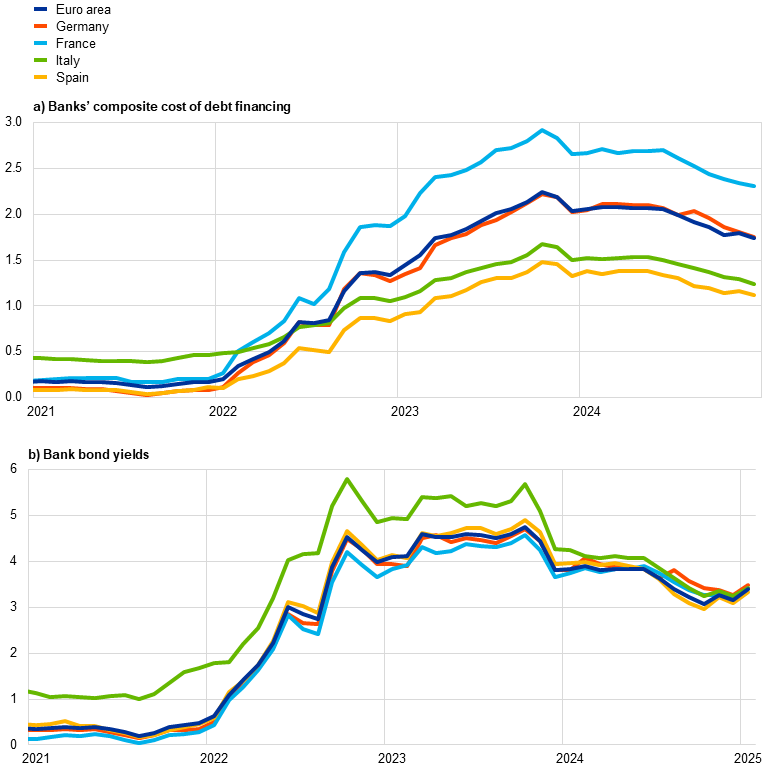
Sources: ECB, S&P Dow Jones Indices LLC and/or its affiliates, and ECB calculations.
Notes: Composite bank funding costs are a weighted average of the composite cost of deposits and unsecured market-based debt financing. The composite cost of deposits is calculated as an average of new business rates on overnight deposits, deposits with an agreed maturity and deposits redeemable at notice, weighted by their respective outstanding amounts. Bank bond yields are monthly averages for senior tranche bonds. The latest observations are for December 2024 for the composite cost of debt financing for banks (panel a) and for 29 January 2025 for bank bond yields (panel b).
Bank lending rates for firms and for households declined further. Lending rates for firms and households have fallen since the summer of 2024, reflecting lower policy rates (Chart 17). In November 2024, lending rates for new loans to non-financial corporations (NFCs) fell by 15 basis points to stand at 4.52%, around 80 basis points below their October 2023 peak (Chart 17, panel a), this fall being widespread across the largest euro area countries. The spread between interest rates on small and large loans to firms widened in November to 0.48%. Lending rates on new loans to households for house purchase edged down by 8 basis points to stand at 3.47% in November, around 60 basis points below their November 2023 peak (Chart 16, panel b), with variation across countries. The decline was broad-based across fixation periods and more pronounced for variable rate mortgages, which nonetheless remained more expensive than those granted at fixed rates.
Chart 17
Composite bank lending rates for firms and households in selected euro area countries
(annual percentages)
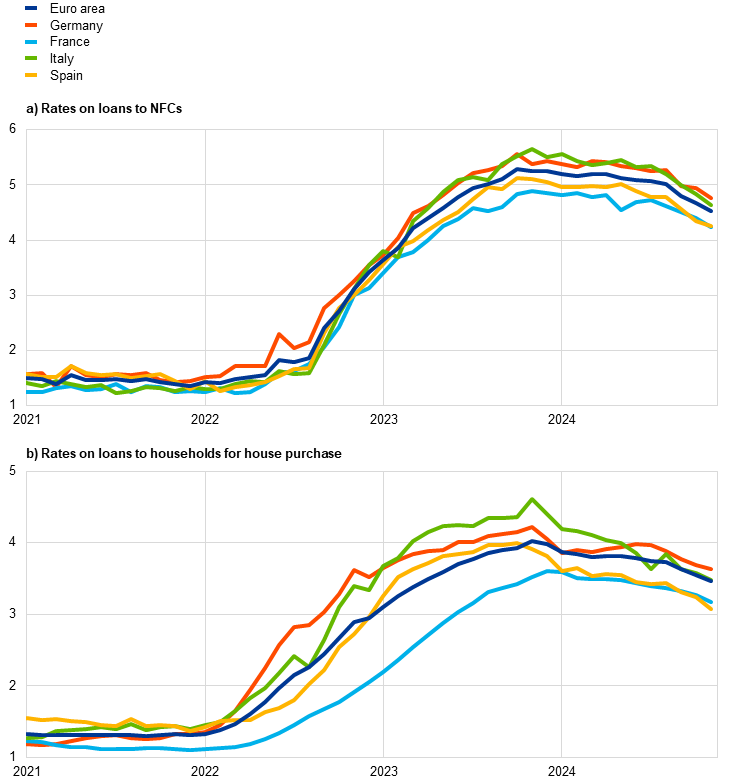
Sources: ECB and ECB calculations.
Notes: NFCs stands for non-financial corporations. Composite bank lending rates are calculated by aggregating short and long-term rates using a 24-month moving average of new business volumes. The latest observations are for November 2024.
Over the period from 12 December 2024 to 29 January 2025, the cost to firms of market-based debt financing rose, while the cost of equity financing fell. Based on the monthly data, available until November 2024, the overall cost of financing for NFCs – i.e. the composite cost of bank borrowing, market-based debt and equity – declined in November compared with the previous month and stood at 5.6%, sliding further below the multi-year high reached in October 2023 (Chart 18).[8] The fall in November 2024 was accounted for by lower costs for both market-based debt and bank borrowing, while the cost of equity financing remained virtually unchanged. Daily data covering the period from 12 December 2024 to 29 January 2025 show that the cost of market-based debt financing increased, driven by an upward shift in the overnight index swap (OIS) curve. At the same time, the cost of equity financing declined following a lower equity risk premium that offset the higher long-term risk-free rate – as approximated by the ten-year OIS rate.
Chart 18
Nominal cost of external financing for euro area firms, broken down by component
(annual percentages)
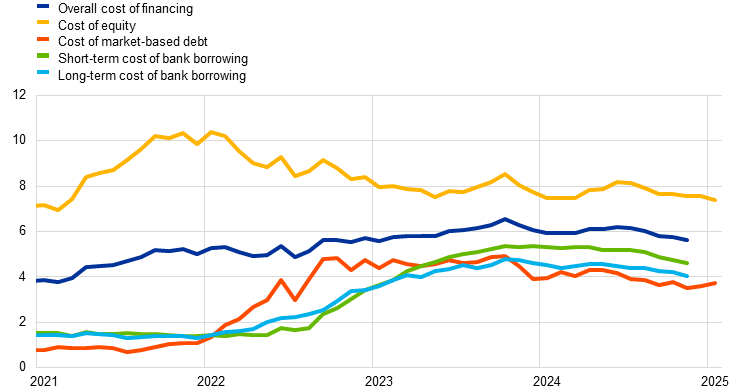
Sources: ECB, Eurostat, Dealogic, Merrill Lynch, Bloomberg, LSEG and ECB calculations.
Notes: The overall cost of financing for non-financial corporations (NFCs) is based on monthly data and is calculated as a weighted average of the long and short-term cost of bank borrowing (monthly average data), market-based debt and equity (end-of-month data), based on their respective outstanding amounts. The latest observations are for 29 January 2025 for the cost of market-based debt and the cost of equity (daily data), and for November 2024 for the overall cost of financing and the cost of borrowing from banks (monthly data).
Growth in loans to firms and households increased in December but remained weak, reflecting still subdued demand and tight credit standards. The annual growth rate of bank lending to firms rose to 1.5% in December 2024, up from 1.0% in November 2024, amid a strong monthly flow, but remaining well below its historical average of 4.8% (Chart 19, panel a). In contrast, the annual growth rate of corporate debt securities decreased to 3.2% in December from 3.6% in November. The annual growth rate of loans to households strengthened further to 1.1% in December, up from 0.9% in November, although remaining well below its historical average of 4.1% (Chart 19, panel b). This gradual recovery continued to be driven by housing loans. Consumer credit grew by 3.6% in December, while other lending to households, including loans to sole proprietors, is still contracting, albeit at a decelerating pace. The ECB’s Consumer Expectations Survey in November 2024 showed that the percentage of households who perceived credit access to have been tighter still outweighs that perceiving credit access to have been easier.
Chart 19
MFI loans in selected euro area countries
(annual percentage changes)

Sources: ECB and ECB calculations.
Notes: Loans from monetary financial institutions (MFIs) are adjusted for loan sales and securitisation; in the case of non-financial corporations (NFCs), loans are also adjusted for notional cash pooling. The latest observations are for December 2024.
In the January 2025 euro area bank lending survey, banks reported a renewed tightening of credit standards for loans to firms in the fourth quarter of 2024 and broadly unchanged credit standards for housing loans, after three quarters of easing (Chart 20). Credit standards for loans to firms saw their most pronounced (net) tightening since the third quarter of 2023 and this was accompanied by an increase in the share of rejected loan applications. The net tightening was driven by higher perceived risks related to the economic outlook and by lower risk tolerance on the part of banks. Banks reported broadly unchanged credit standards for loans to households for house purchase and a small reduction in the share of rejected applications. The stability of credit standards for housing loans is in contrast to the strong net easing that banks had expected in the previous quarter. In terms of drivers, while competition among banks exerted downward pressure on housing loan credit standards, banks’ risk tolerance and risk perceptions had a tightening effect. For consumer credit and other lending to households, banks reported a (net) increase in the share of rejected applications and a further (net) tightening of credit standards, primarily driven by risk perceptions and banks’ risk tolerance. For the first quarter of 2025, euro area banks expect a further tightening of credit standards for loans to firms, for consumer credit and for housing loans.
In the fourth quarter of 2024, banks reported a slight increase in loan demand by firms, although that demand remained weak overall, while housing loan demand continued to rebound strongly. The rise in loan demand by firms was driven by lower interest rates, while fixed investment exerted a muted impact. For housing loans, the strong increase in demand primarily reflected falling interest rates and, to a lesser extent, improving housing market prospects. While demand for consumer credit was also supported by declining interest rates, it was dampened by weak consumer confidence, as well as low spending on durables and the use of alternative finance from other banks and non-banks. For the first quarter of 2025, banks expect broadly unchanged demand for loans to firms and a further increase in demand for loans to households.
Chart 20
Changes in credit standards and net demand for loans to NFCs and loans to households for house purchase
(net percentages of banks reporting a tightening of credit standards or an increase in loan demand)
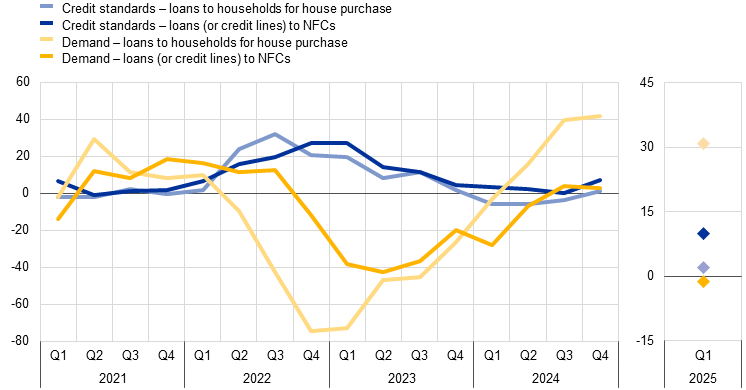
Source: Euro area bank lending survey.
Notes: NFCs stands for non-financial corporations. For survey questions on credit standards, “net percentages” are defined as the difference between the sum of the percentages of banks responding “tightened considerably” and “tightened somewhat” and the sum of the percentages of banks responding “eased somewhat” and “eased considerably”. For survey questions on demand for loans, “net percentages” are defined as the difference between the sum of the percentages of banks responding “increased considerably” and “increased somewhat” and the sum of the percentages of banks responding “decreased somewhat” and “decreased considerably”. The diamonds denote expectations reported by banks in the current round. The latest observations are for the fourth quarter of 2024.
The ad hoc survey questions suggested that access to funding slightly deteriorated and perceived risks to credit quality had a tightening impact on credit standards for firms and consumers. Banks reported that their access to funding worsened somewhat for retail funding, money markets and debt securities in the last quarter of 2024. Supervisory and regulatory measures contributed to an increase in banks’ required capital, as well as in their liquid and risk-weighted assets, which in turn contributed to a tightening of credit standards, especially for loans to firms. Perceived credit quality in bank loan portfolios also had a significant tightening effect on credit standards for both loans to firms and consumer credit in the second half of 2024, whereas the impact was neutral for housing loans. Over this same period, credit standards for firms continued to tighten across all the main economic sectors, especially in commercial real estate, wholesale and retail trade, construction and energy-intensive manufacturing. Loan demand decreased in net terms in commercial real estate, construction and energy-intensive manufacturing, and remained broadly unchanged in the other sectors. Banks reported that the decline in excess liquidity held with the Eurosystem had had a neutral impact on bank lending conditions in the second half of 2024, and a similar outcome is expected in the first half of 2025.
In the latest Survey on Access to Finance of Enterprises (SAFE), firms reported a decrease in bank interest rates, while noting a further slight tightening of other loan conditions. In the fourth quarter of 2024, a net 4% of firms confirmed a decline in bank interest rates, compared with a net 4% reporting increases in the previous quarter. At the same time, a net 22% of firms (down from 30% in the third quarter of 2024) pointed to a rise in other financing costs, such as charges, fees and commissions. Firms also reported stricter collateral requirements than in the third quarter of 2024.
Chart 21
Changes in euro area firms’ bank loan needs, current and expected availability and financing gap
(net percentages of respondents)
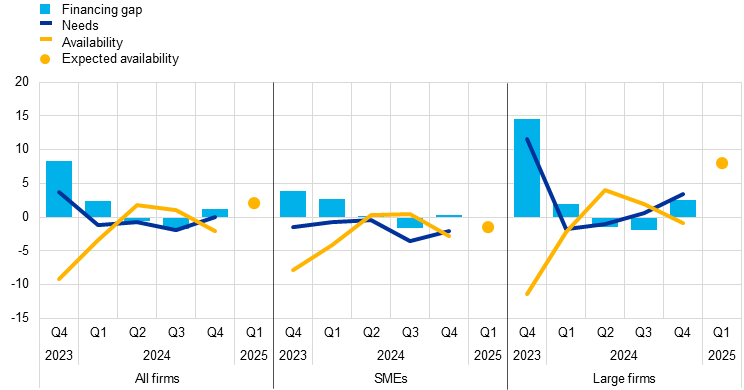
Sources: Survey on Access to Finance of Enterprises (SAFE) and ECB calculations.
Notes: SMEs stands for small and medium-sized enterprises. Net percentages are the difference between the percentage of firms reporting an increase in availability of bank loans (needs and expected availability respectively) and the percentage reporting a decrease in availability in the past three months. The financing gap indicator combines both financing needs and the availability of bank loans at firm level. The indicator of the perceived change in the financing gap takes a value of 1 (-1) if the need increases (decreases) and availability decreases (increases). If firms perceive only a one-sided increase (decrease) in the financing gap, the variable is assigned a value of 0.5 (-0.5). A positive value for the indicator points to a widening of the financing gap. Expected availability has been shifted forward by one period to allow for a direct comparison with realisations. Values are multiplied by 100 to obtain weighted net balances in percentages. The figures refer to Pilot 2 and Rounds 30 to 33 of the SAFE (October-December 2023 to October-December 2024).
Firms saw unchanged bank loan needs, together with a small decline in bank loan availability, with few expecting significant improvements in that availability over the next three months (Chart 21). The small decrease in the availability of bank loans in the fourth quarter of 2024 coincided with the recent tightening of bank credit policies, especially as regards credit standards, as highlighted in the euro area bank lending survey for the same period. The financing gap for bank loans – an index capturing the difference between changes in needs and in availability – widened for a net 1% of firms, compared with a net 2% of firms experiencing a narrowing of that gap in the previous quarter. Looking ahead, firms expect to see small improvements in bank loan availability over the next three months, this expectation chiefly being held by large firms, while SMEs anticipate a slight decline in availability.
The annual growth rate of broad money (M3) in the euro area declined slightly to 3.5% in December, amid some monthly volatility. Annual M3 growth stood at 3.5% in December 2024, down from 3.8% in November but broadly unchanged from October (Chart 22). Annual growth of narrow money (M1) – which comprises the most liquid assets of M3 – increased further to 1.8% in December, compared with 1.5% in November. The annual growth rate of overnight deposits – a component of M1 – rose to 1.8% in December, up from 1.5% in November. The contribution of net foreign flows, which have been the main source of money creation since late 2023, is showing tentative signs of weakening, while the contribution of lending to firms and households is gaining weight. In contrast, the ongoing contraction of the Eurosystem balance sheet and the issuance of long-term bank bonds (which are not included in M3) amid the phasing out of targeted longer-term refinancing operations (TLTROs) funding by the end of 2024 continued to contribute negatively to M3 growth.
Chart 22
M3, M1 and overnight deposits
(annual percentage changes, adjusted for seasonal and calendar effects)
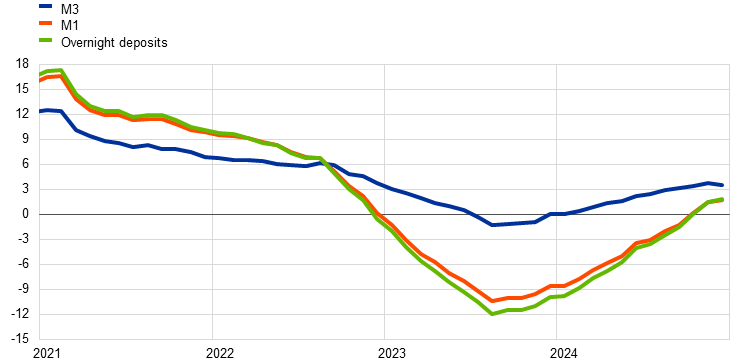
Source: ECB.
Note: The latest observations are for December 2024.
Boxes
1 The outlook for services inflation in the United States and the United Kingdom
While headline inflation has decelerated significantly across advanced economies in the past two years, services inflation has remained high. Since peaking in mid-2022, headline inflation in advanced economies (excluding the euro area) has declined significantly, supported mainly by falling or negative contributions from energy and core goods prices (Chart A). At the same time, services inflation has remained high, representing by far the largest component of headline inflation.[9] This box analyses the main drivers of services inflation in the United States and the United Kingdom, disentangling services inflation excluding rents from rent inflation, as they follow different dynamics. Specifically, the box highlights the role of labour market tightness and catch-up dynamics in non-rent services inflation.[10]
More2 Are real incomes increasing or not? Household perceptions and their role for consumption
Over the past few years private consumption has risen at a slower pace than real disposable income.[11] Chart A illustrates the diverging paths of real income and private consumption during the last three years. According to the national accounts, real household income increased by 3.8% between the second quarter of 2022 and the second quarter of 2024. However, real private consumption did not follow the same trend, growing by only 1.2% over the same period. It is well documented that past personal experiences affect the economic decisions of households.[12] Thus, one possible explanation for the slower consumption growth is that the recent inflation surge has scarred people’s beliefs, causing households to perceive their real income to be lower than it actually is.[13] As households adjust their actual consumption on the basis of these beliefs, such perceptions can have an effect on consumer spending. In this box, we use data from the ECB’s Consumer Expectations Survey (CES) to assess this factor for the euro area.
More3 The role of demographics in recent developments in the unemployment rate
Demographic changes in the euro area labour market affect the unemployment rate. The euro area unemployment rate has decreased by 0.9 percentage points since the fourth quarter of 2021, falling to 6.3% in October 2024, its lowest level since the creation of the euro.[14] This decline occurred despite the significant increase in the size of the labour force, which grew by 3.5% between the fourth quarter of 2021 and the third quarter of 2024. This increase was largely attributable to non-EU labour[15], older workers[16] and workers with a tertiary education. These groups grew by 24.7%, 9.9% and 7.9% respectively (Chart A) and increased not only in terms of their respective sizes but also as regards their participation rates. The degree to which demographic shifts in the labour force can affect unemployment rates varies depending on the different characteristics of the groups concerned, including the differing unemployment risks of their professions and their job tenures. For instance, workers with longer job tenures often have greater protection against layoffs under employment legislation. Furthermore, experienced workers and workers with higher educational attainment levels frequently find new jobs more quickly after becoming unemployed. Demographic characteristics, such as age, educational attainment and nationality can therefore affect the likelihood of being employed or unemployed. Against this backdrop, this box explores the role of labour supply factors in driving the unemployment rate and, more specifically, the potential contributions of demographic developments.[17]
More4 The economic impact of floods
Extreme weather events like the devastating flash floods that hit Spain last October have substantial human, social and economic impacts. Climate change is making these types of event more commonplace and the trend is predicted to go on rising. Moreover, it is not only increasing frequency that is of concern but also greater potency, as evidenced in south-eastern Spain, which until now has not seen as frequent flooding as other regions in Europe (Figure A). In October 2024, some weather stations near Valencia recorded a year’s worth of rain in just eight hours.[18] By one early estimate, the event was made twice as likely, and 12% more powerful, than it would have been in the absence of human-made climate change.[19]
More5 Main findings from the ECB’s recent contacts with non‑financial companies
This box summarises the findings of recent contacts between ECB staff and representatives of 82 leading non-financial companies operating in the euro area. The exchanges took place between 6 and 14 January 2025.[20]
Contacts pointed to subdued business momentum at the turn of the year, with flat or declining manufacturing output but more resilient growth in services activity (Chart A and Chart B). Weakness in manufacturing was increasingly viewed as structural, reflecting high energy and labour costs, an inhibitive regulatory environment and increased import competition. Growth in services activity was driven both by consumer spending and by demand for business services focused on efficiency and the transformation of business models.
More6 Changes to the Eurosystem collateral framework to foster greater harmonisation
The collateral framework for Eurosystem credit operations is a key element of the ECB’s monetary policy implementation framework. Credit operations have always played a central role in meeting banks’ liquidity needs and steering the monetary policy stance, and the ECB has a statutory requirement to lend to banks and other counterparties only against adequate collateral.[21]
More7 From press conferences to speeches: the impact of the ECB’s monetary policy communication
Monetary policy communication is important for managing expectations and enhancing the effectiveness of monetary policy in the pursuit of price stability. The primary means of conveying monetary policy decisions is through statements and announcements made following the Governing Council’s monetary policy meetings, which are typically held every six weeks. However, further communication between these meetings – in the form of speeches, interviews and an account of the last meeting – also plays a significant role in shaping policy expectations.
More8 Natural rate estimates for the euro area: insights, uncertainties and shortcomings
Estimates of the natural rate of interest, or r*, show trends that are of fundamental significance for monetary policy, but are subject to important caveats. r* is defined as the real rate of interest that is neither expansionary nor contractionary. Measures of r* are typically constructed as an equilibrium value towards which interest rates tend to gravitate in the medium to long term, as aggregate saving and investment imbalances abate and the inflationary or disinflationary pressures that may have developed as a consequence of those imbalances dissipate. These measures are also informative regarding the risk of short-term interest rates becoming constrained by their effective lower bound. However, available measures of r* are fraught with measurement and model specification challenges and are highly uncertain, reflecting, to different degrees, model, parameter, filter and real-time data uncertainty. While estimates of r* provide complementary information for monetary policy decisions and aid communication on the stance of monetary policy, these cannot be seen as a mechanical gauge of appropriate monetary policy at any point in time. In conducting monetary policy, there is no alternative to taking decisions on the basis of a comprehensive analysis of the data and their macroeconomic implications. In the euro area, in particular, the focus of such an assessment is threefold: the inflation outlook in light of the incoming economic and financial data, the dynamics of underlying inflation and the strength of monetary policy transmission.
MoreArticles
1 European competitiveness: the role of institutions and the case for structural reforms
Competitiveness has returned to the top of the European agenda. Sustainable, long-term economic growth supports price stability and gives monetary policymakers more room for manoeuvre.[22] Long-standing challenges related to low productivity growth, burdensome regulations and demographic headwinds have been exacerbated by geopolitical tensions, trade fragmentation and the prospect of persistently high energy prices. Recent reports by Mario Draghi and Enrico Letta have highlighted these challenges and the need for urgent and concrete action that will enable Europe to catch up and maintain a competitive edge over its global competitors.[23],[24] The priority of the incoming European Commission is to speed up the rate of reform and investment, placing a particular focus on innovation, decarbonisation and strategic autonomy.[25]
More2 Wage developments during and after the high inflation period
Wages are key to the assessment of inflation and thus for monetary policy. Inflation both shapes and is shaped by wage developments. Wages represent an input cost to firms. In turn, productivity-adjusted wages affect firms’ price-setting decisions and thus inflationary pressures, while workers base wage claims on current and past inflation and on inflation expectations. Moreover, wages represent a significant part of income for households and therefore affect consumption and saving decisions.
More3 Green investment needs in the EU and their funding
The green transition towards a climate-neutral economy is a key challenge for the EU and requires substantial investment to 2030 and beyond. Climate-related disasters are increasing in frequency and severity in Europe and elsewhere, pointing to substantial investment needs to speedily decarbonise the economy and adapt the EU to a changing climate. Estimates of the additional amount that should be invested in capital expenditure and low carbon-emitting durable consumption goods each year until the end of this decade range from 2.7% to 3.7% of 2023 EU GDP. A delay in the decarbonisation, in particular at the global level, would push up transition and adaptation costs even further. At the same time, an investment-led transition towards a low-carbon economy will entail a wide-ranging structural shift, which is expected to affect growth and prices as well as the financial sector. For all these reasons, the ECB is carefully monitoring developments, as outlined in this article.[27]
MoreStatistics
https://www.ecb.europa.eu/pub/pdf/ecbu/ecb.eb_annex202501~2bf81ab5b5.en.pdf© European Central Bank, 2025
Postal address 60640 Frankfurt am Main, Germany
Telephone +49 69 1344 0
Website www.ecb.europa.eu
All rights reserved. Reproduction for educational and non-commercial purposes is permitted provided that the source is acknowledged.
For specific terminology please refer to the ECB glossary (available in English only).
The cut-off date for the statistics included in this issue was 29 January 2025.
PDF ISSN 2363-3417, QB-01-25-044-EN-N
HTML ISSN 2363-3417, QB-01-25-044-EN-Q
The advance estimate of GDP for the fourth quarter of 2024 was published on 30 January 2025, one day after the cut-off date for data included in this issue of the Economic Bulletin.
The cut-off date for the data included in this issue of the Economic Bulletin was 29 January 2025, except for GDP data, which had a cut-off date of 30 January.
The annual growth rate is based on seasonally and calendar adjusted figures. Unadjusted data are not available for all the Member States included in GDP flash estimates.
This implies that GDP would grow by 0.3% in 2025 if all quarterly growth rates this year were zero (i.e. if quarterly GDP remains at the same level as in the fourth quarter of 2024).
The cut-off date for the data included in this issue of the Economic Bulletin was 29 January 2025. According to the flash estimate from Eurostat, HICP inflation increased to 2.5% in January 2025.
For more information, see Lane, P.R., “Underlying inflation: an update”, speech at the Inflation: Drivers and Dynamics Conference 2024 organised by the Federal Reserve Bank of Cleveland and the ECB, 24 October 2024.
For more information on the results of the January 2025 Corporate Telephone Survey, see the box entitled “Main findings from the ECB’s recent contacts with non-financial companies”, Economic Bulletin, Issue 1, ECB, 2025.
Owing to lags in data availability for the cost of borrowing from banks, data on the overall cost of financing for NFCs are only available up to November 2024.
One factor behind the strong contribution of services inflation, compared with core goods, energy or food, is the larger weight of services in the consumer price index (CPI): 53.9% based on OECD weights, compared with 25.6% for core goods, 12.7% for food and 7.8% for energy. This may also reflect a slower pass-through of energy price shocks to services inflation than to energy and core goods inflation (see, for example, Kilian, L., “The Economic Effects of Energy Price Shocks”, Journal of Economic Literature, Vol. 46, Issue 4, December 2008, pp. 871-909).
For an analysis of the role of catch-up dynamics in wage inflation in the euro area, see the box entitled “Recent developments in wages and the role of wage drift”, Economic Bulletin, Issue 6, ECB, 2024.
For a more detailed exploration of how experiences can “scar” consumers, see Malmendier, U. and Shen, L.S., “Scarred Consumption”, American Economic Journal: Macroeconomics, Vol. 16, No 1, 2024, pp. 322-355. For previous work on understanding developments in, and perceptions of, household disposable income, see the box entitled “A primer on measuring household income”, Economic Bulletin, Issue 8, ECB, 2023. Other possible explanations for the slower consumption growth may relate to rebuilding buffers after a large shock, uncertainty about geopolitical events, or time lags in spending adjustments that are not related to the scarring of beliefs.
For a summary of recent advances in behavioural economics regarding the role of long-lasting effects of past experience in economic decisions, see Malmendier, U. and Wachter, J. A., “Memory of Past Experiences and Economic Decisions”, The Oxford Handbook of Human Memory, 2024.
See, for example, Colarieti, R., Mei, P. and Stantcheva, S., “The How and Why of Household Reactions to Income Shocks”, NBER Working Paper, No 32191, 2024.
See the article entitled “Explaining the resilience of the euro area labour market between 2022 and 2024”, Economic Bulletin, Issue 8, ECB, 2024.
Throughout this box, “non-EU labour” is used to refer to workers who are not citizens of an EU country, “intra-EU labour” to workers who are citizens of an EU country but not of the country where they are working, and “foreign workers” to workers who are not citizens of the country in which they form part of the labour force. “National workers” refers to citizens of a euro area country working in that country.
For the purposes of this study, young workers are those in the 15-24 age group, prime-age workers are those in the 25-54 age group and older workers are those in the 55-74 age group.
The current dynamics of the unemployment rate have also benefited from labour hoarding in the euro area, which has helped to contain layoffs. For an analysis and estimates of labour hoarding, see the box entitled “Higher profit margins have helped firms hoard labour”, Economic Bulletin, Issue 4, ECB, 2024.
“Devastating rainfall hits Spain in yet another flood-related disaster”, World Meteorological Organization, 31 October 2024.
“Extreme downpours increasing in southeastern Spain as fossil fuel emissions heat the climate”, World Weather Attribution, 4 November 2024.
For further information on the nature and purpose of these contacts, see the article entitled “The ECB’s dialogue with non-financial companies”, Economic Bulletin, Issue 1, ECB, 2021.
See Article 18.1 of the Statute of the European System of Central Banks and of the European Central Bank.
Filip, M. D., Momferatou, D. and Parraga-Rodriguez, S., “Why a more competitive economy matters for monetary policy”, The ECB Blog, ECB, 11 February 2025.
See Draghi, M., “The future of European competitiveness – A competitiveness strategy for Europe”, European Commission, September 2024; and Letta, E., “Much more than a market”, April 2024.
Due to data restrictions and numerous sources referring to different subsets of EU countries, together with the fact that competitiveness discussions are not restricted to the euro area, for the purpose of this article we use the concept of “Europe” to refer interchangeably to the euro area, the European Union (EU) and any narrower EU group of countries.
Several proposals made in the Draghi report have been incorporated into Ursula Von der Leyen’s political guidelines for the next European Commission 2024-29 presented to the European Parliament in July 2024, the mission letters sent to the Commissioners-designate in September 2024, and the recently published Competitiveness Compass for the EU.
Prepared in liaison with Laurent Abraham, Krzysztof Bańkowski, Tina Emambakhsh, Annalisa Ferrando, Charlotte Grynberg, Johannes Groß, Lucia Hoendervangers, Vasileios Kostakis, Daphne Momferatou, Carlo Pasqua, Matthias Rau-Goehring, Erzsebet-Judit Rariga, Desislava Rusinova, Ralph Setzer, Martina Spaggiari, Fabio Tamburrini, Josep Maria Vendrell Simon and Francesca Vinci.
The topic of “green investment and its financing” was identified as one of the main focus areas in the ECB’s climate and nature plan 2024-2025 published in January 2024.